EO Unlocked: Metadata Search Engine for Earth Observation
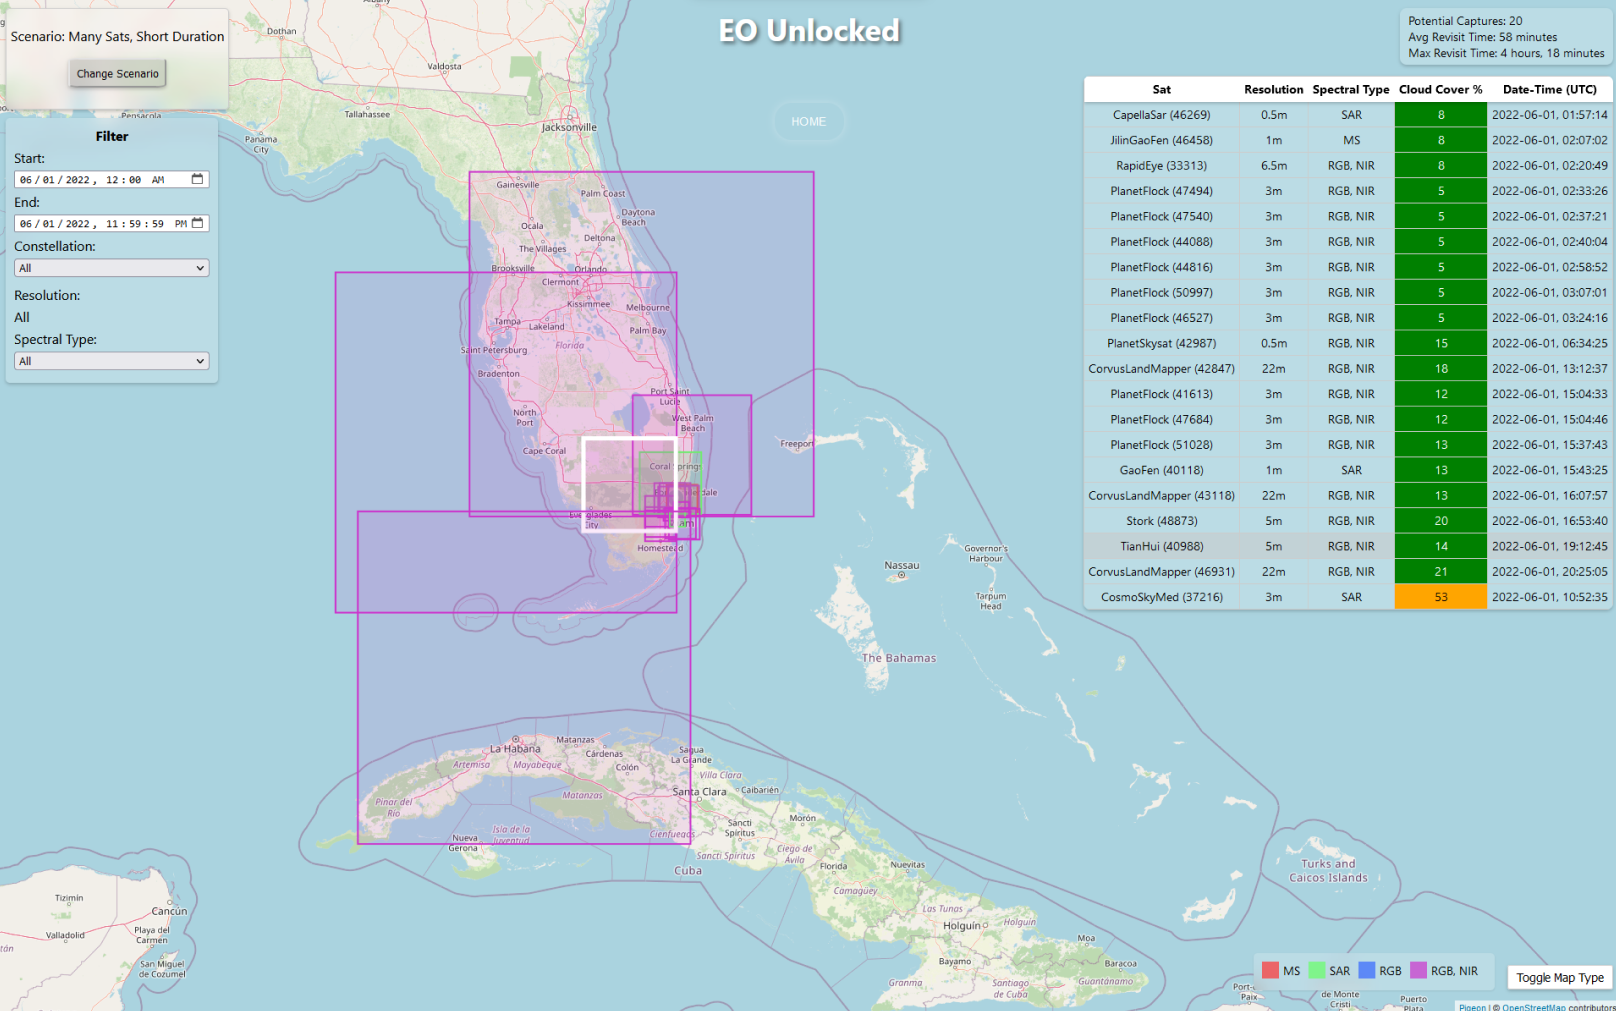
Live demoEO Unlocked is a user-centric Earth observation discovery interface for modeling virtual constellations and past, present, and future opportunities for coordination across commercial and civil assets. Inspired by Cory Doctorow's writing on adversarial interoperability, it synthesizes public metadata into a system-level view without requiring direct integration with individual satellite operators or their APIs. Essentially, it is Google Flights for Earth observation: who can see what and when.
It uses space situational awareness data from CelesTrak to propagate satellite orbits with SGP4, then makes predicted observation footprints searchable through spatial computation with an R-Tree index. A React and ThreeJS-based GUI enables search and filtering of results. It also incorporates supplemental weather data from the Open-Meteo API, since cloud cover can influence access opportunities.
Sensor specifications for thousands of spacecraft were mined from ESA's eoPortal, the World Meteorological Organization's Oscar tool, Nanosats EU, and Gunter's Space Page. The unstructured data was then synthesized and organized programmatically using the OpenAI API.
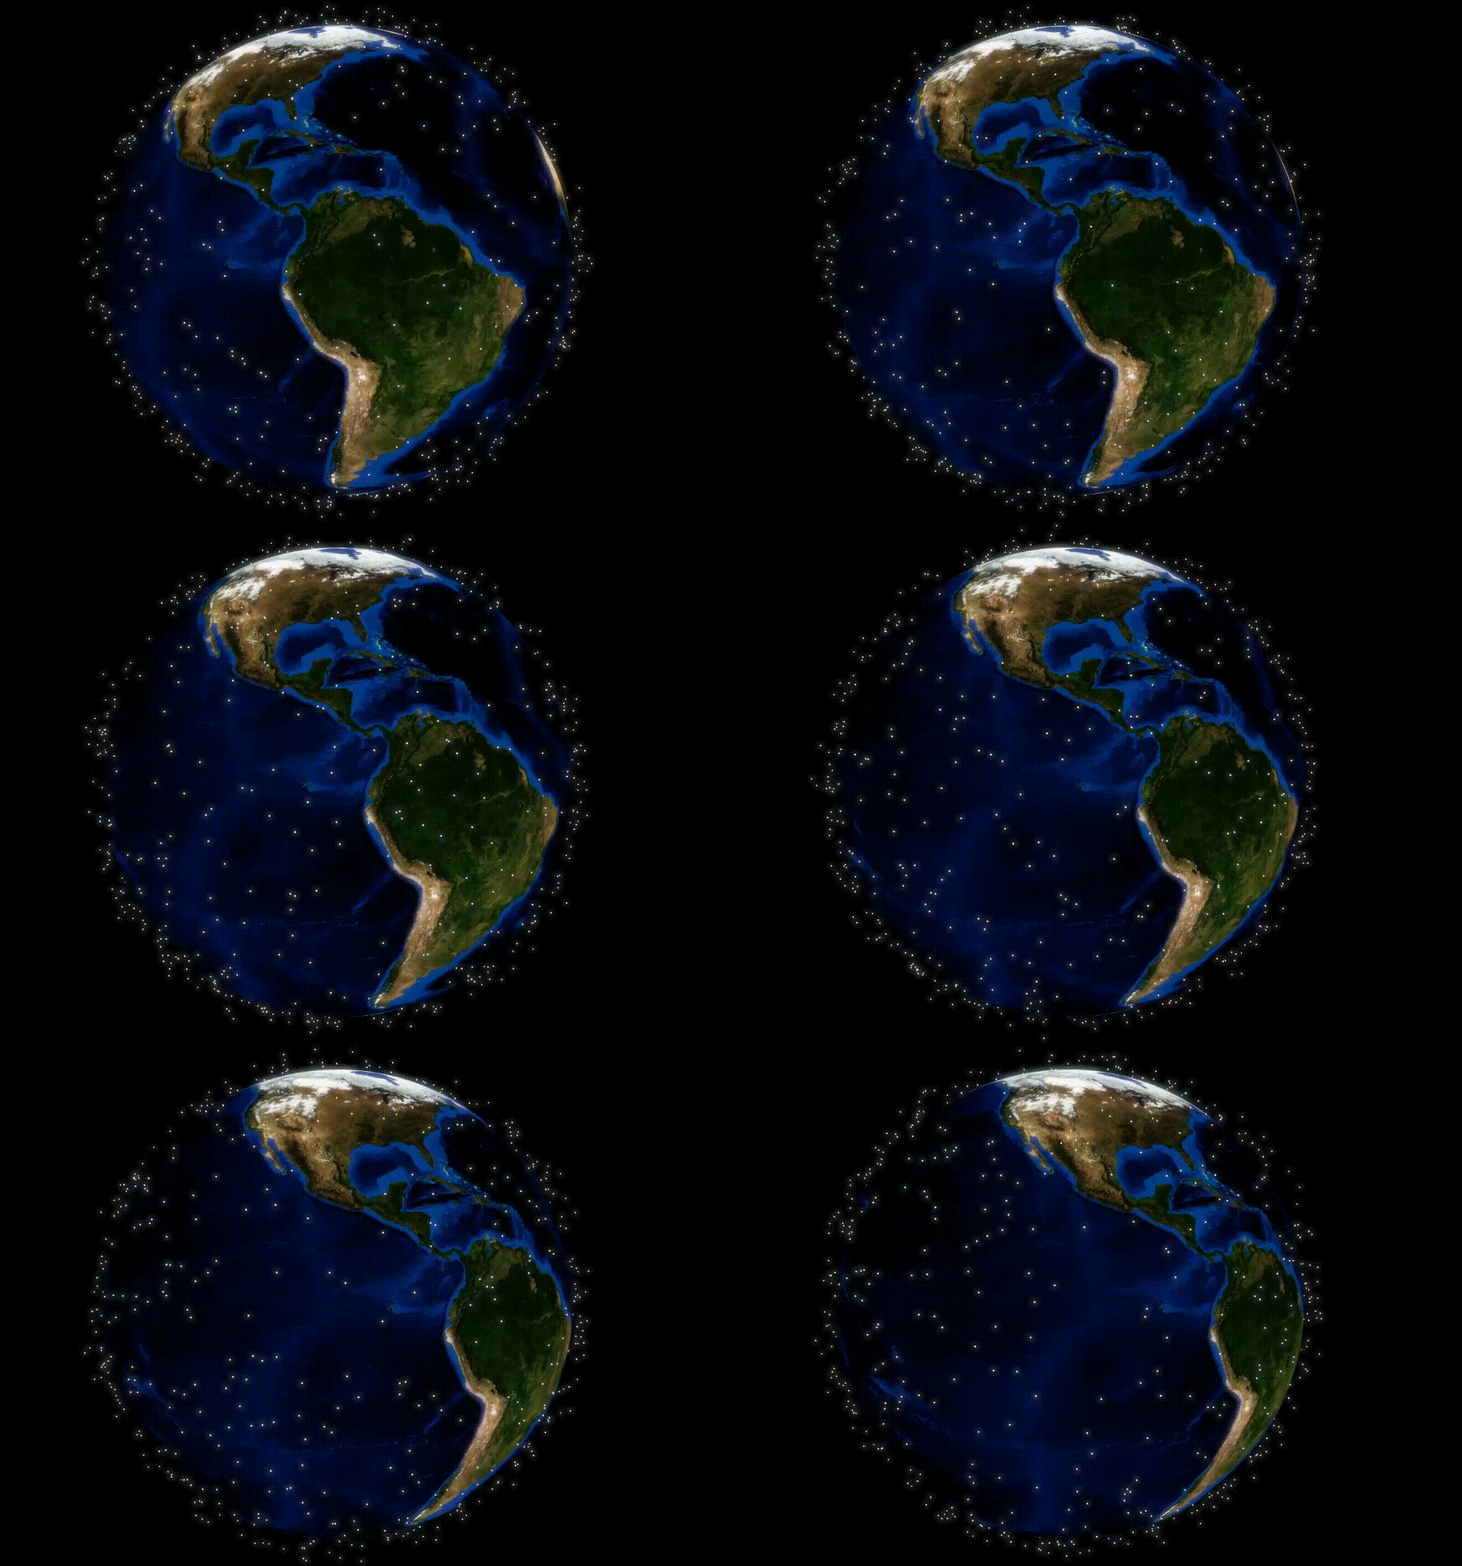
Simply select a location and historical timeframe of interest and receive instant results for predicted visual footprints (at nadir) of a virtual constellation of more than 350 spacecraft, ranked by cloud coverage.
Los Angeles Freeway Time-Space Cartogram
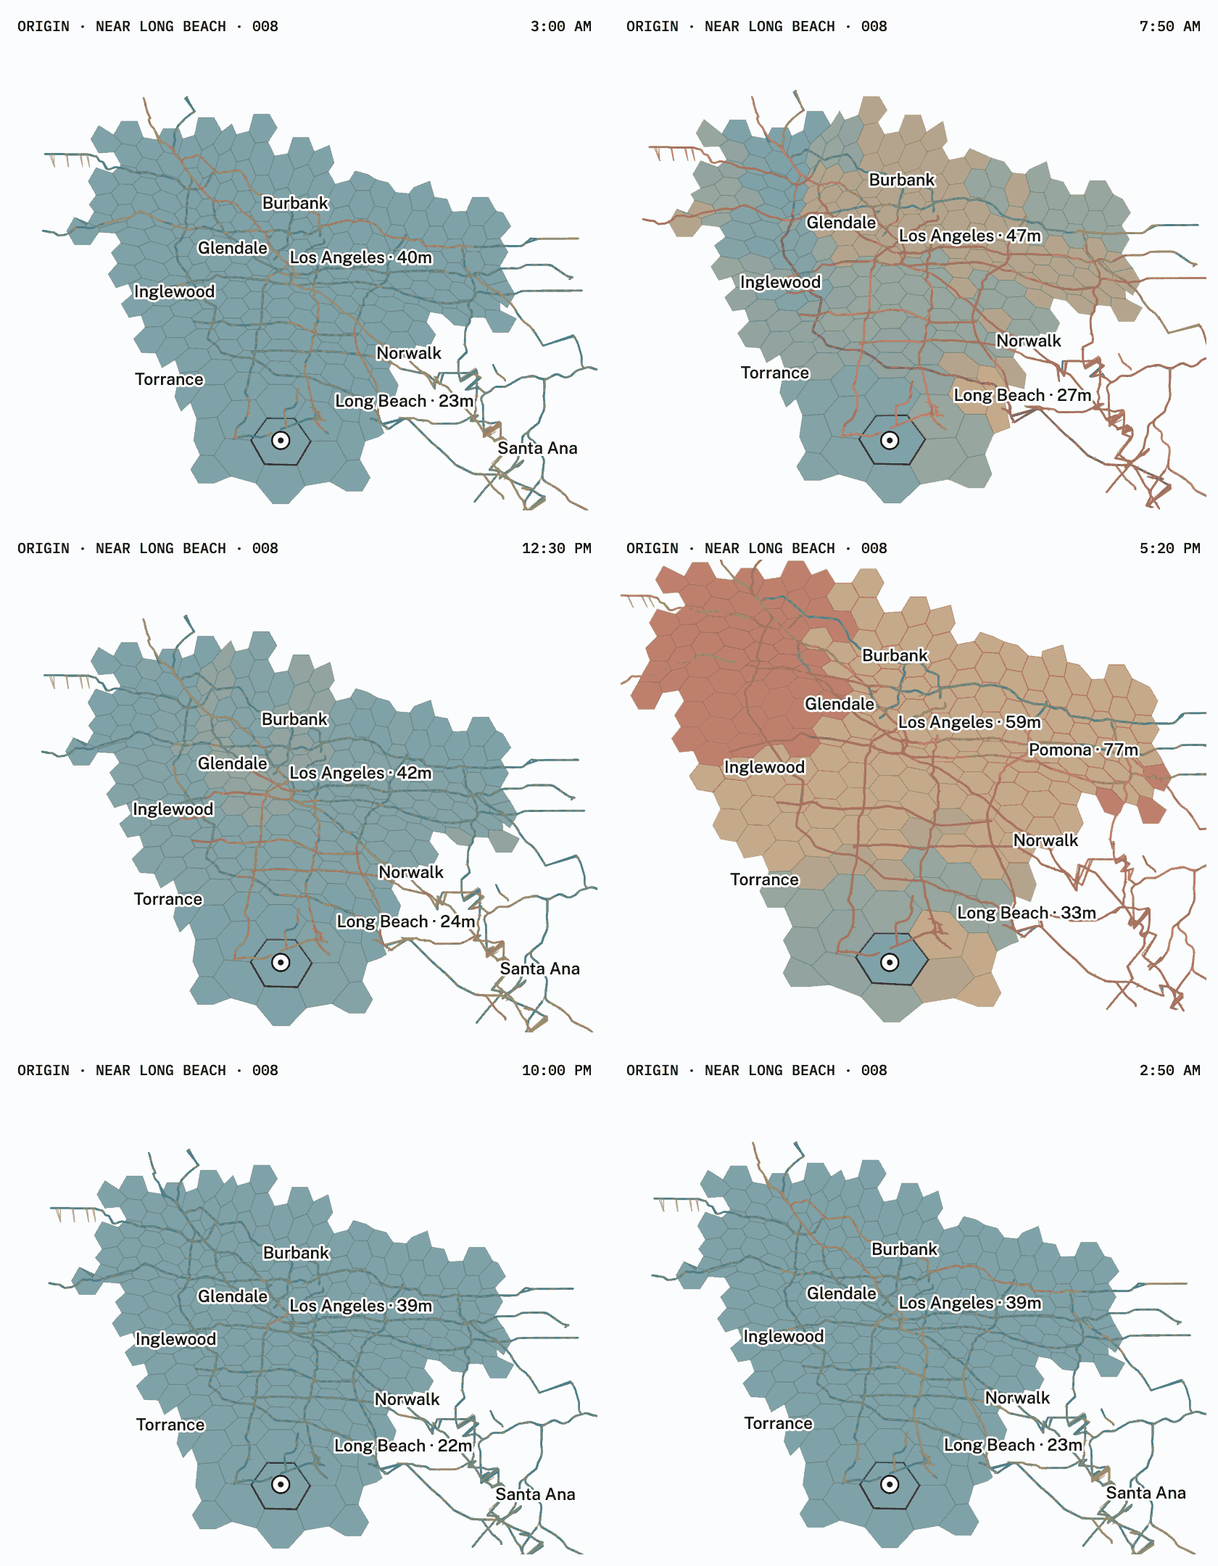
Open interactive cartogramIn Los Angeles, distance is measured as much in minutes as in miles: a ten-mile trip can take ten minutes or an hour, depending on the time of day. This interactive experiment redraws the city according to freeway travel time rather than geographic distance. Roughly 200 freeway-served catchments expand and contract across a typical weekday using five-minute median speeds from 207 Caltrans PeMS sensors in the historical METR-LA dataset.
2022 LA County Toxic Waste Release Hazard to K-12 Educational Institutions: A Geospatial Analysis
This analysis maps 2022 Toxic Release Inventory (TRI) facilities near K-12 schools in Los Angeles County to identify areas of potential exposure concern using spatial buffers and overlays. Of the TRI sites analyzed, 92.9% were within one mile of a school, and 64 schools were near multiple high-emissions facilities.
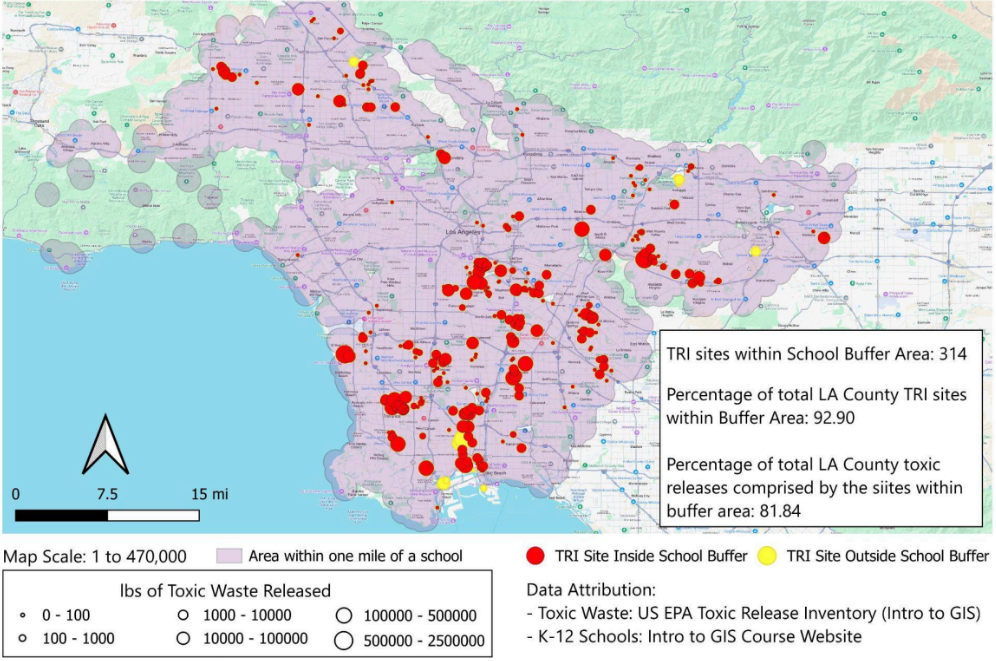
LA TRI facilities overlaid over areas within one mile of a school.
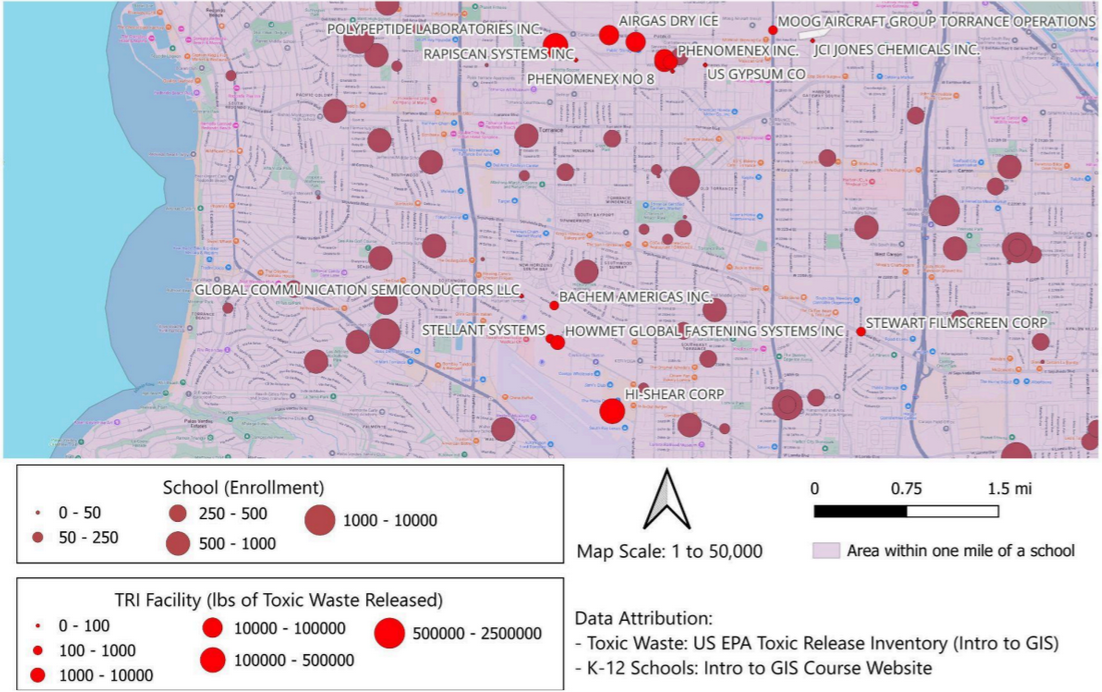
Significant large TRI emissions site count in proximity to schools, with Torrance highlighted.
California Wildfire Hazard and Insurance Stress Dashboard
Wildfire risk is reshaping California's housing and insurance markets, but the physical and financial sides of the problem are rarely viewed together. Built in ArcGIS Experience Builder, this dashboard combines wildfire hazard and insurance stress indicators in interactive maps and charts to show where those pressures overlap.
Rising Sea Level Risks to Miami (2100 Inundation Projections)
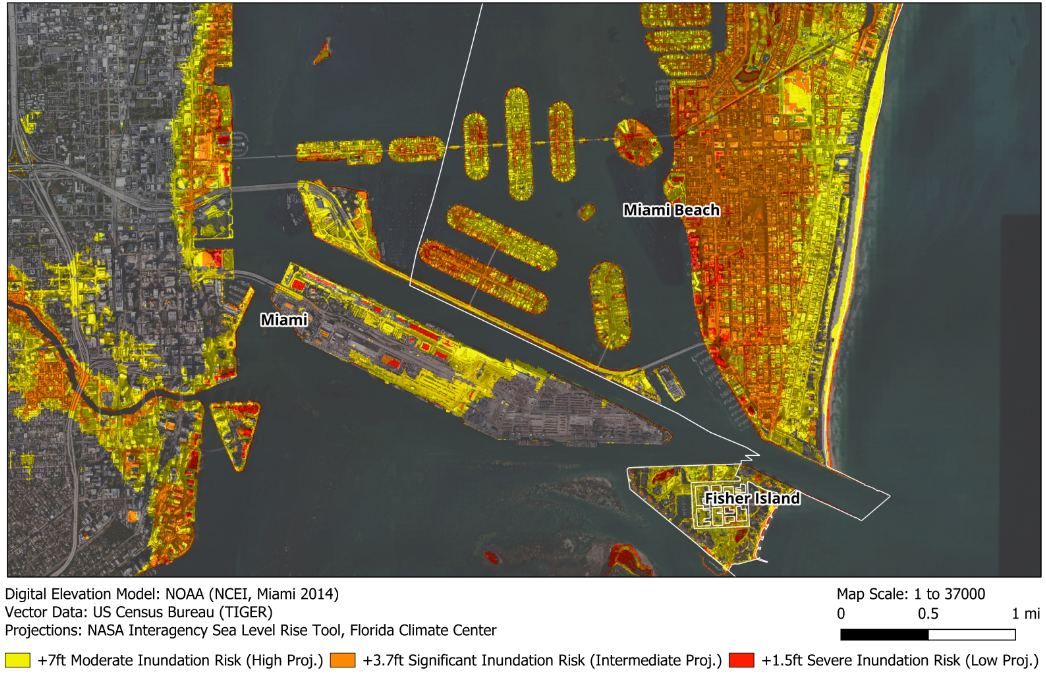
This analysis maps potential 2100 inundation across Miami using NASA and Florida Climate Center projections applied to a digital elevation model. The results highlight low-lying neighborhoods and infrastructure that become increasingly vulnerable during storm surge and high-tide events.
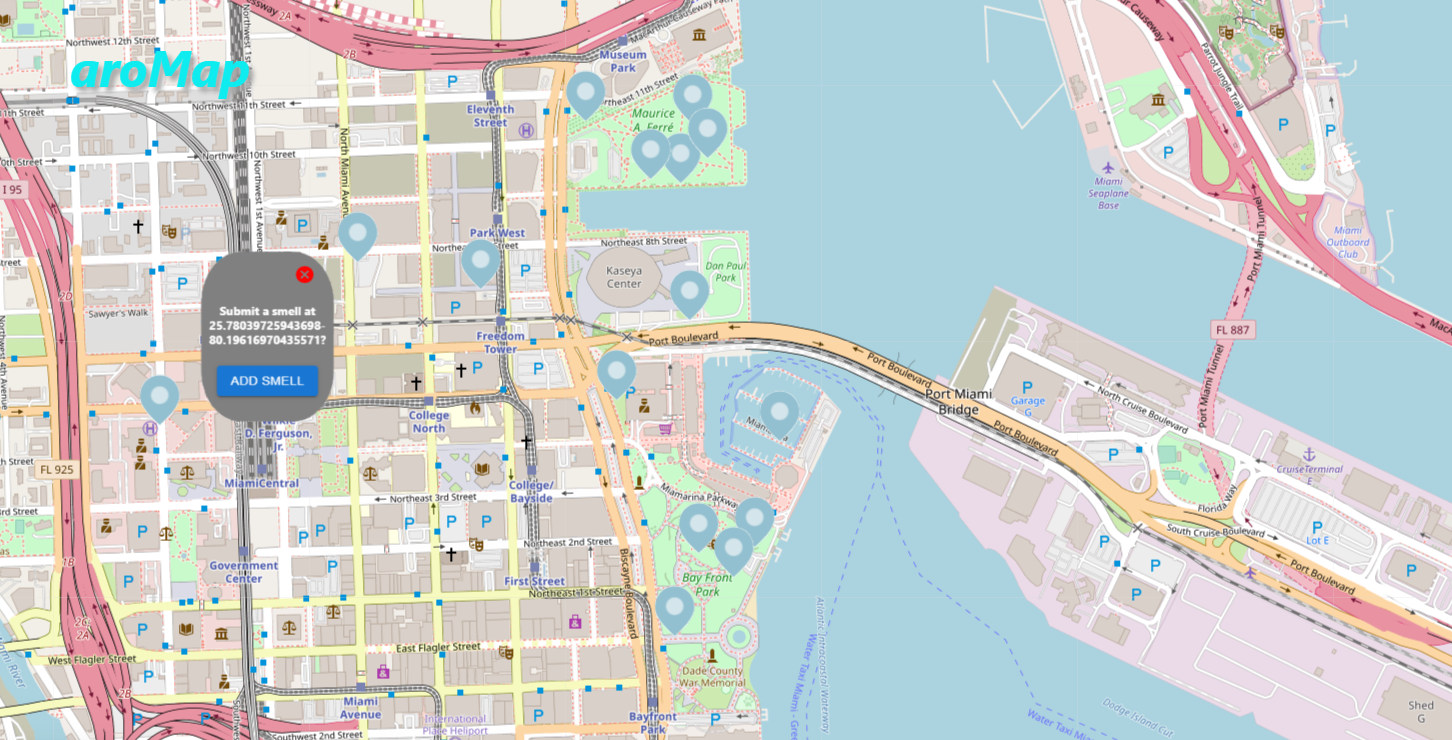
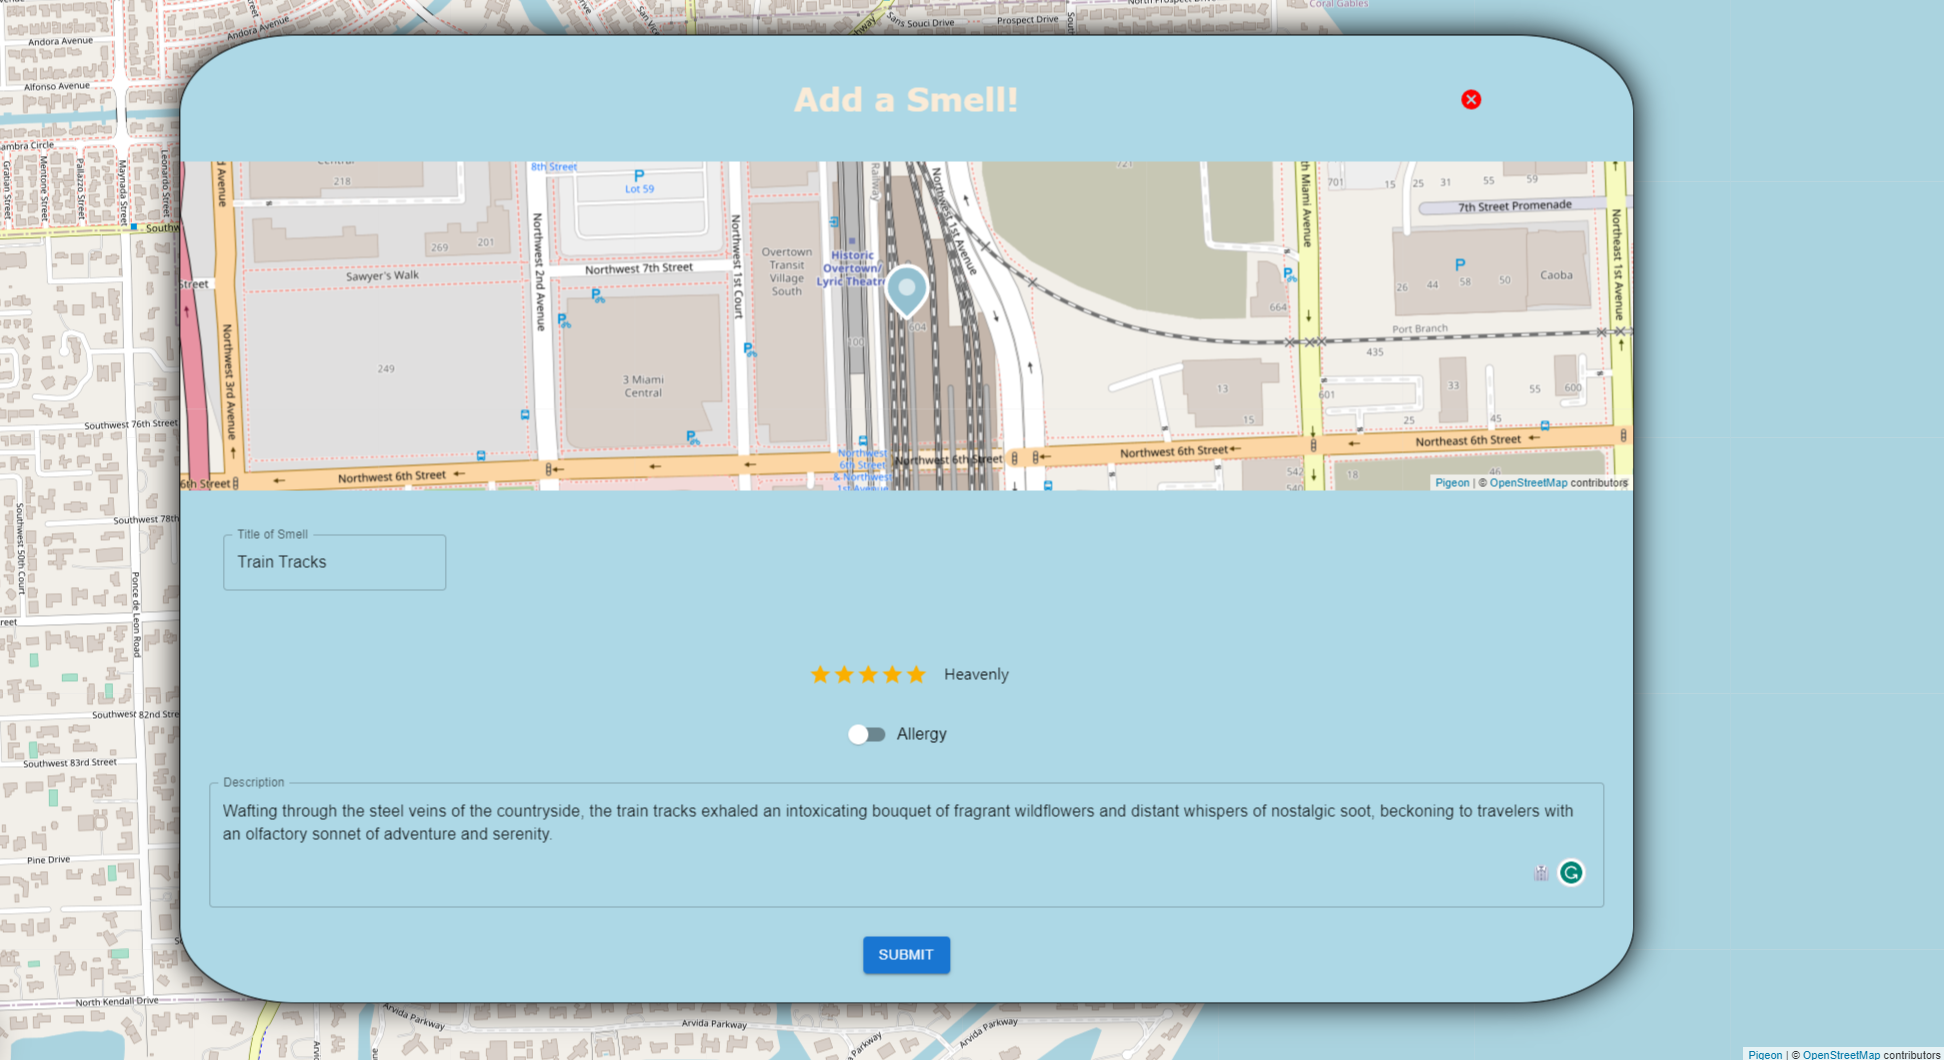
Aromap: The Olfactory Social Network
Track smells around your area. Smell something stinky? Report it! Smell something heavenly and want others to experience it? Enlighten your friends. In a world where smells are our dearest sense, Aromap is your guiding light.